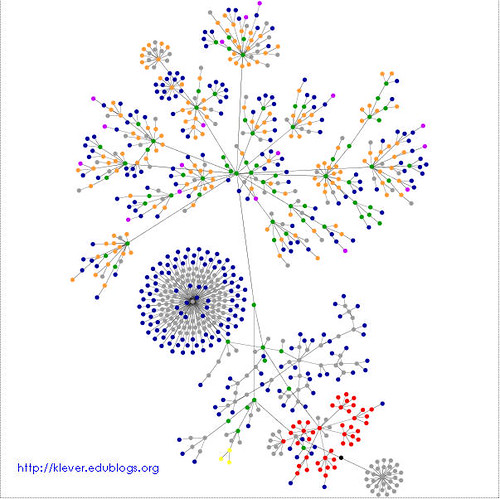
 Discovered via Remote Access this online tool that takes a url from a web site, and turns it into a graph. This is what knowledging across life’s curriculum looks like.
What do the colors mean?
Here is what they say:
blue: for links (the A tag)
red: for tables (TABLE, TR and TD tags)
green: for the DIV tag
violet: for images (the IMG tag)
yellow: for forms (FORM, INPUT, TEXTAREA, SELECT and OPTION tags)
orange: for linebreaks and blockquotes (BR, P, and BLOCKQUOTE tags)
black: the HTML tag, the root node
gray: all other tags
Basically it says a lot about code but very little about anything else. Oh well nice graphics!